Accessing trends
Navigate to Trends in the sidebar to view your analytics dashboard.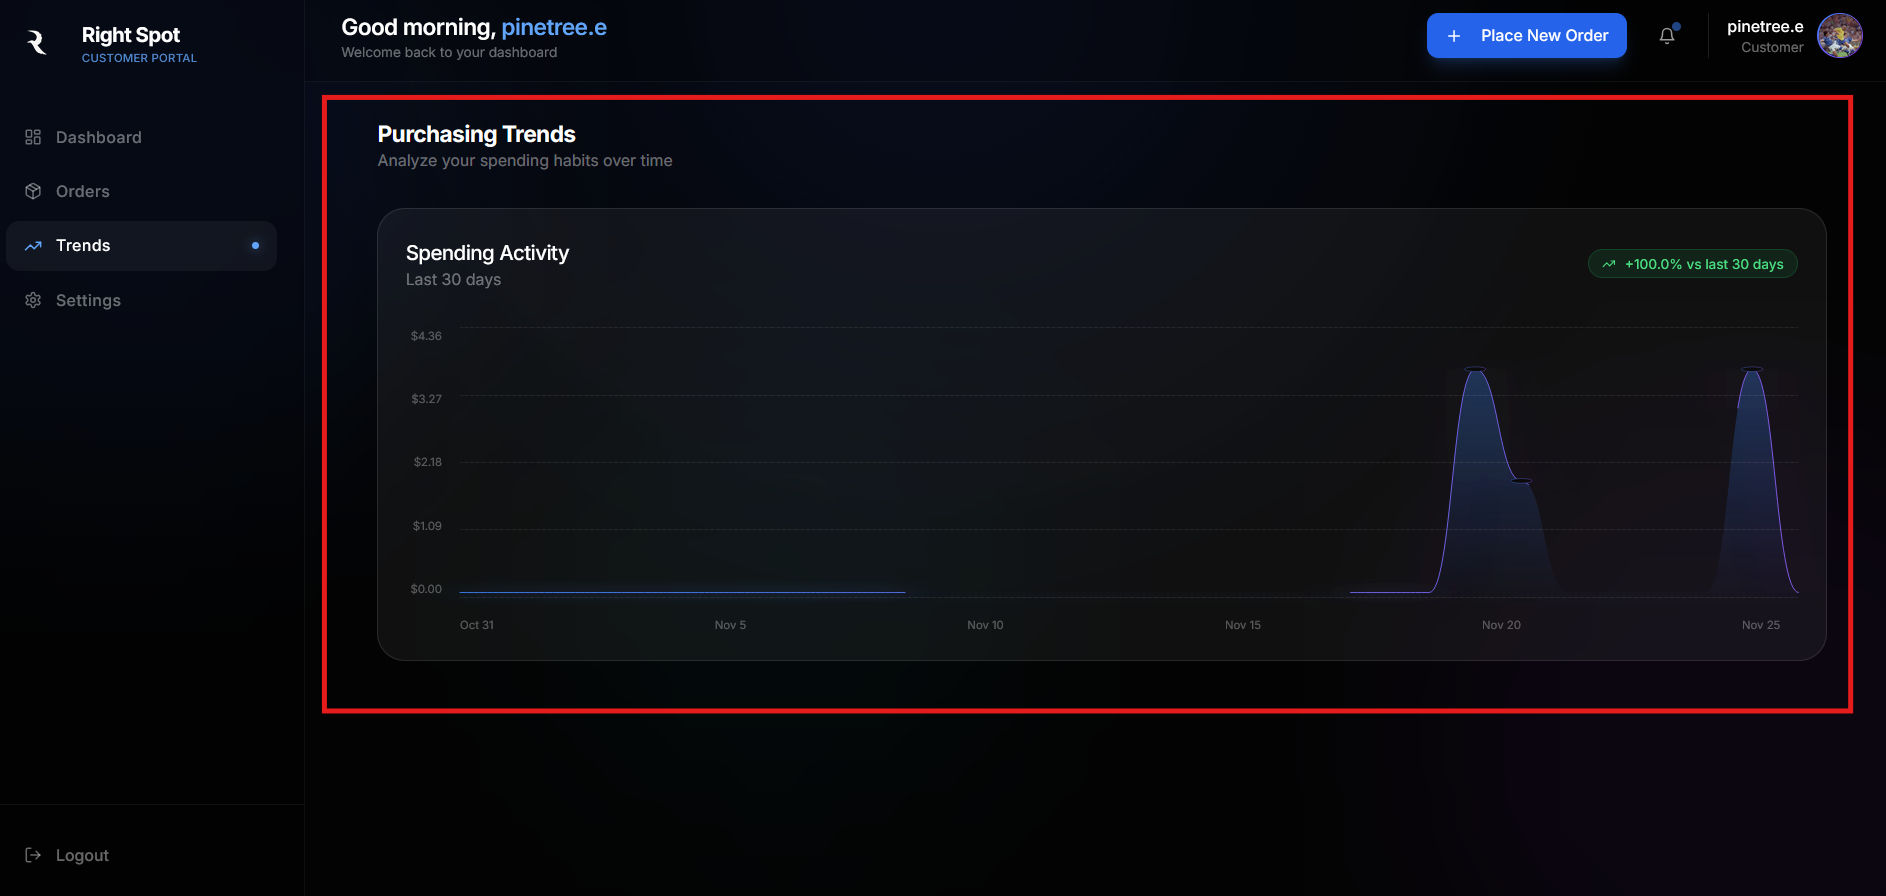
Reading the chart
The chart displays your spending over the selected time period. Each point on the line represents your total spending for that day.- The Y-axis shows the dollar amount spent
- The X-axis shows the date
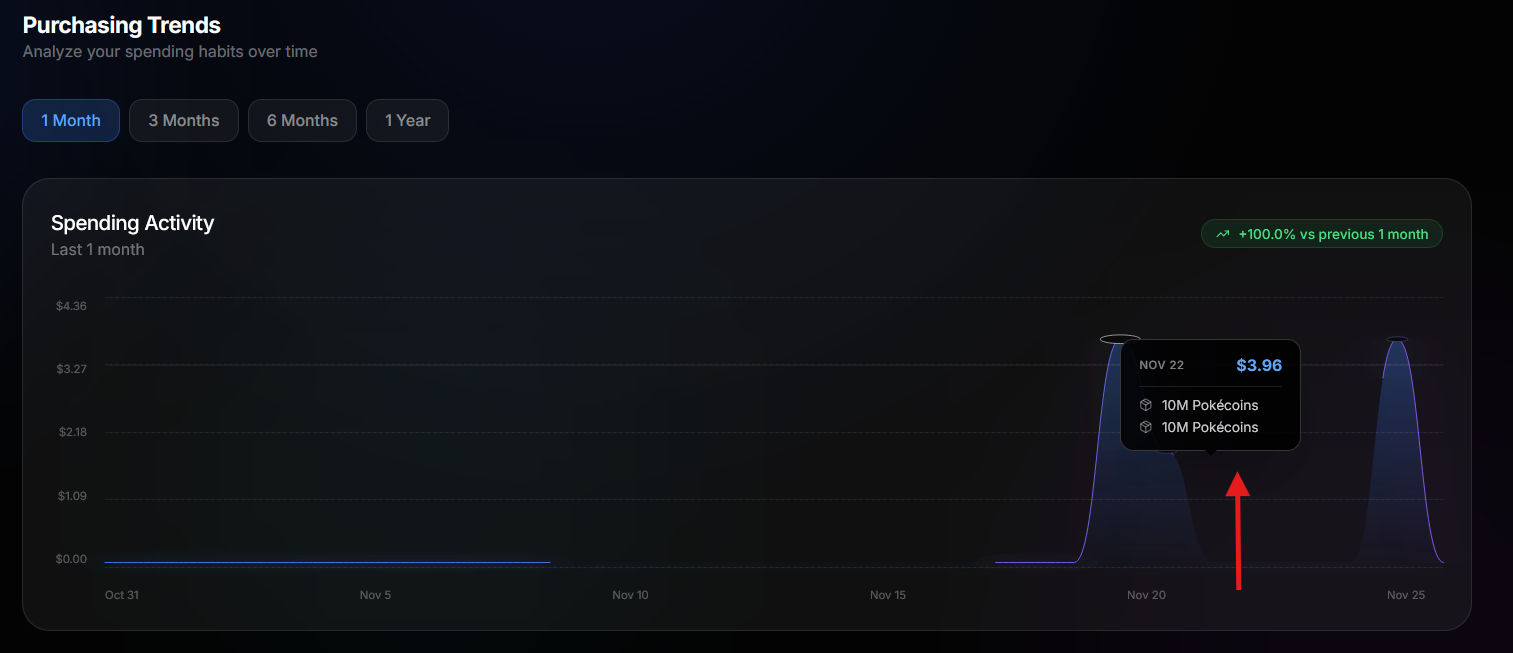
- Hover over any point to see detailed information for that day
Hover details
When you hover over a point on the chart, a tooltip appears showing:- The date
- Total amount spent that day
- Individual orders placed that day with their Pokecoin amounts
Trend indicator
In the top-right corner of the chart, a trend indicator shows how your recent spending compares to the previous period. A green percentage indicates increased spending, while red indicates decreased spending.Time range selection
You can adjust the time range to view different periods of activity. Available options:- 1 Month: View the last 30 days of activity
- 3 Months: View the last 90 days of activity
- 6 Months: View the last 180 days of activity
- 1 Year: View the last 365 days of activity
Empty state
If you have not placed any orders yet, the Trends page displays a message indicating no data is available. Place some orders to start seeing your spending analytics.Configure your account preferences in Settings.